> ## Documentation Index
> Fetch the complete documentation index at: https://docs.kombo.dev/llms.txt
> Use this file to discover all available pages before exploring further.
# Logs
> Learn how Kombo's logs allow you to monitor and troubleshoot your integrations.
## Overview
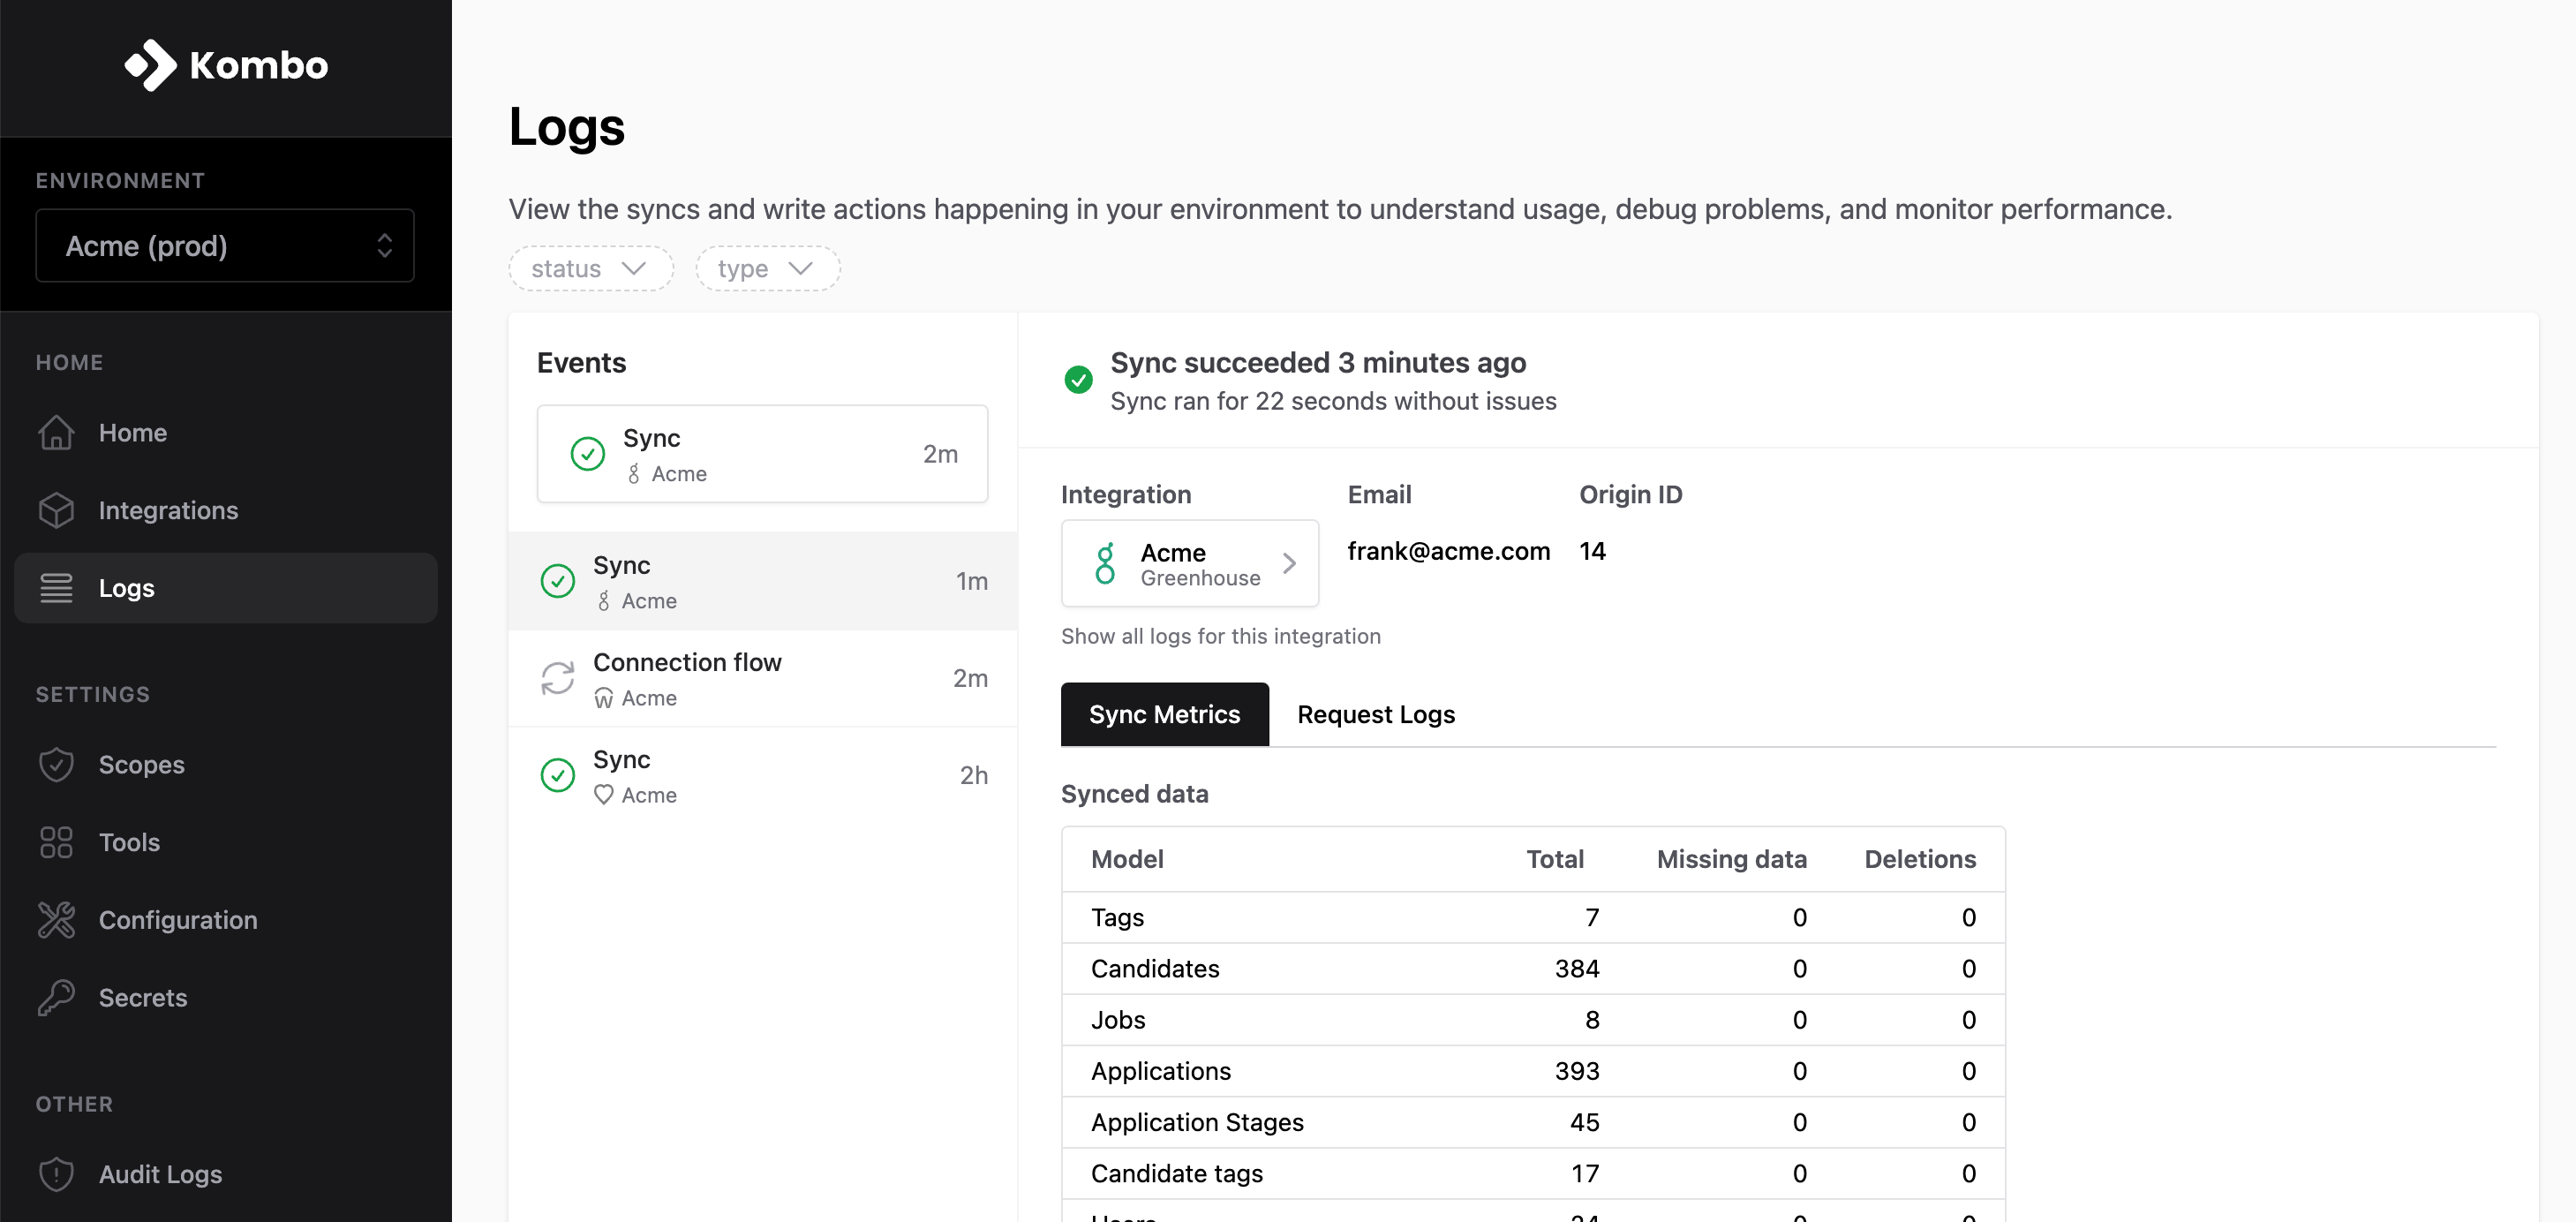
Our logs enable you to dig deeper into what is happening behind your integrations. Depending on the type of interaction, different logs are available.
You can find the logs in the [sidebar of the Kombo dashboard](https://app.kombo.dev/logs).
 ### Available Log types
| Log Type | Description | Features |
| -------------------- | ----------------------------------------------------------------------------------------------------------------------------------------------------------------------------- | ------------------------------------------------------------------------ |
| **Sync** | Created for each recurring sync of an integration | [Sync Metrics](#sync-metrics), [Request Logs](#request-logs) |
| **Connection Flow** | Created for each connection flow interaction | [Event Logs](#connection-flow-event-logs), [Request Logs](#request-logs) |
| **Action** | Created whenever Kombo receives an API request which triggers Kombo to make external API requests to a tool. E.g. [create application](/ats/v1/post-jobs-job-id-applications) | [Request Logs](#request-logs) |
| **Passthrough** | Created for each [passthrough](./passthrough-api) request made | [Request Logs](#request-logs) |
| **Incoming Webhook** | Created whenever a tool sends an API request to Kombo | [Request Logs](#request-logs) |
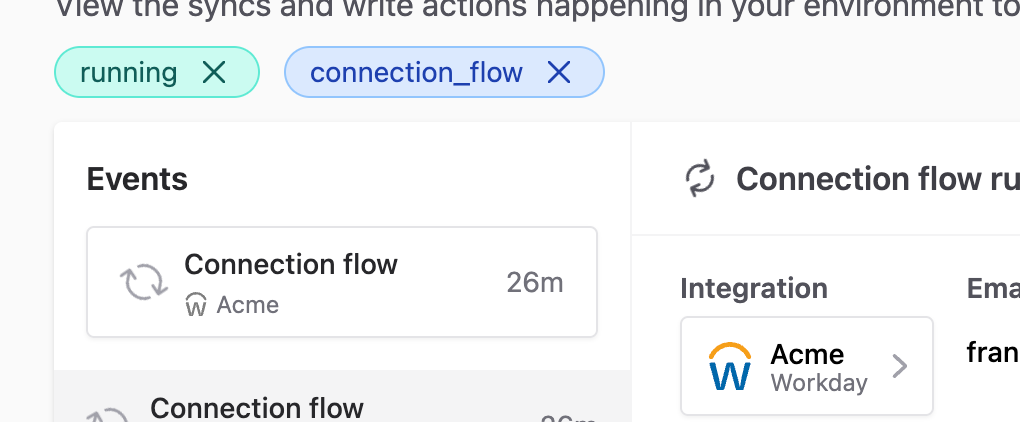
### Filters
Use filters to narrow your search and find exactly what you're searching for.
We additionally make sure to link back to any logs from relevant dashboard pages. For example, you can instantly query an integration's logs by clicking "logs" on the integration's details page.
### Available Log types
| Log Type | Description | Features |
| -------------------- | ----------------------------------------------------------------------------------------------------------------------------------------------------------------------------- | ------------------------------------------------------------------------ |
| **Sync** | Created for each recurring sync of an integration | [Sync Metrics](#sync-metrics), [Request Logs](#request-logs) |
| **Connection Flow** | Created for each connection flow interaction | [Event Logs](#connection-flow-event-logs), [Request Logs](#request-logs) |
| **Action** | Created whenever Kombo receives an API request which triggers Kombo to make external API requests to a tool. E.g. [create application](/ats/v1/post-jobs-job-id-applications) | [Request Logs](#request-logs) |
| **Passthrough** | Created for each [passthrough](./passthrough-api) request made | [Request Logs](#request-logs) |
| **Incoming Webhook** | Created whenever a tool sends an API request to Kombo | [Request Logs](#request-logs) |
### Filters
Use filters to narrow your search and find exactly what you're searching for.
We additionally make sure to link back to any logs from relevant dashboard pages. For example, you can instantly query an integration's logs by clicking "logs" on the integration's details page.
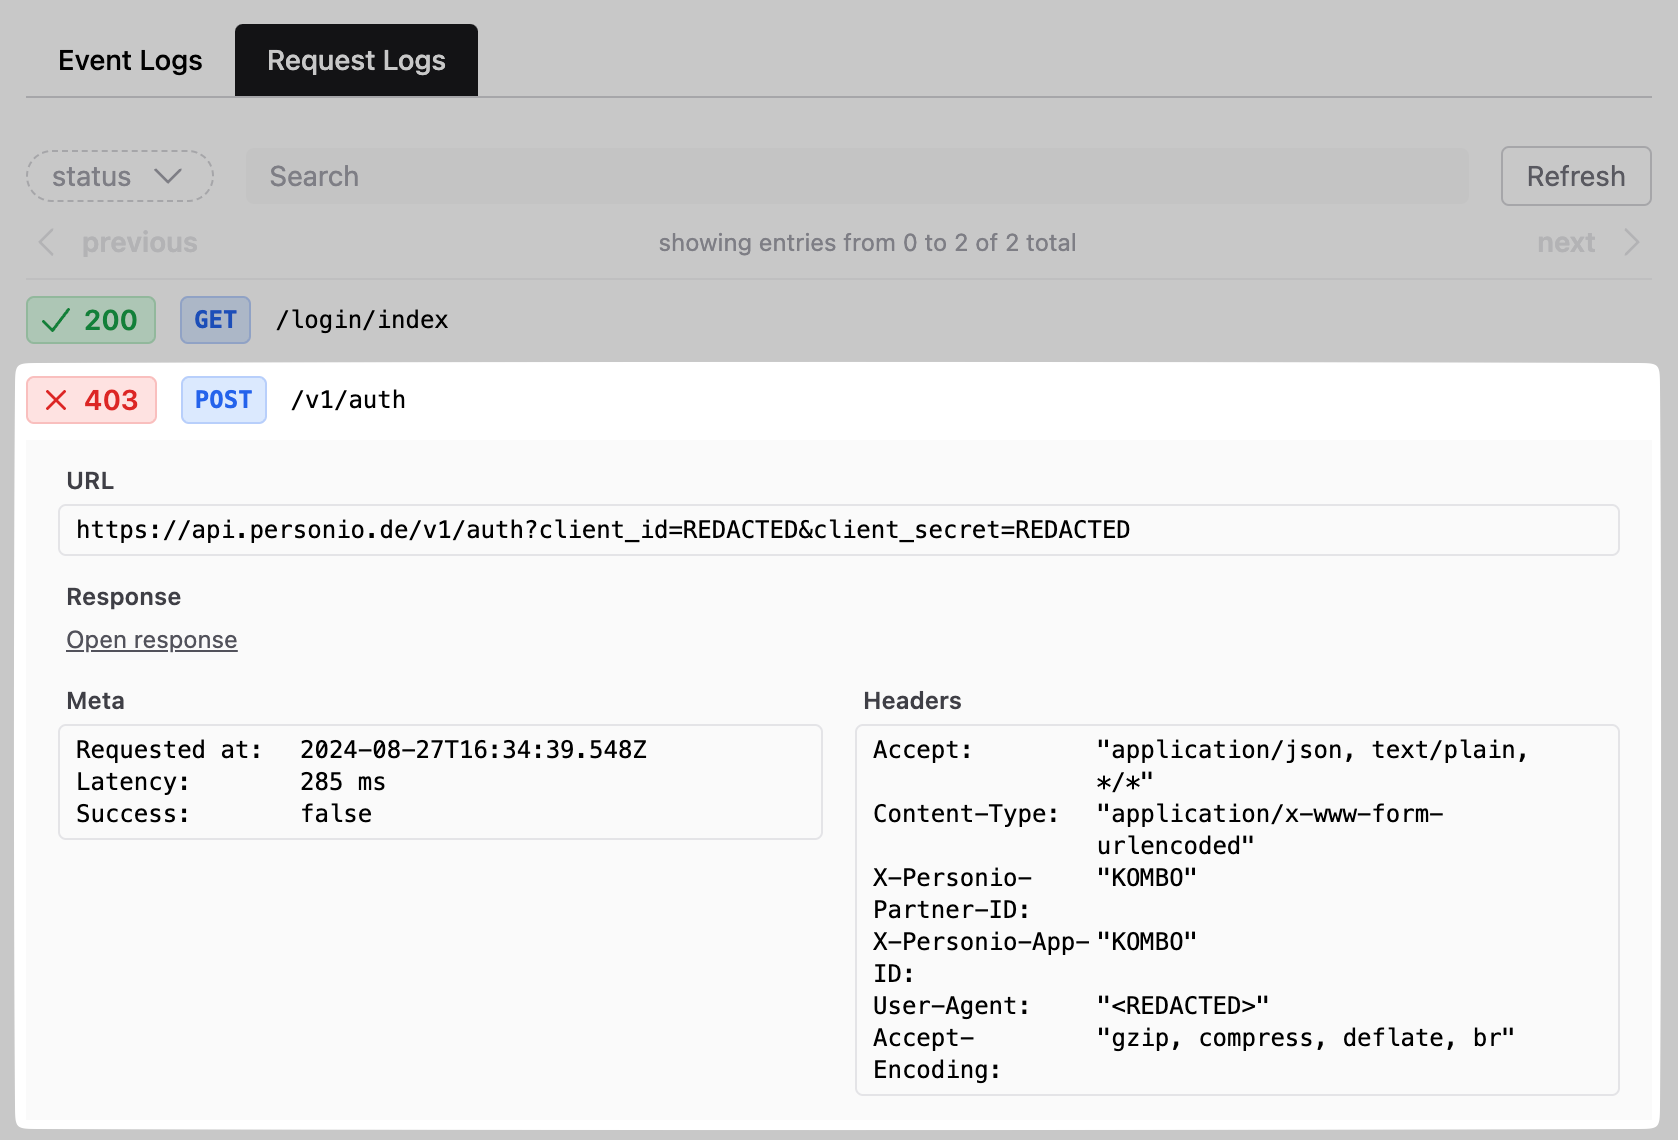
 ## Request Logs
Request logs help you see any API requests that Kombo is making to the integrated tool, and debug any issues. If an integration is having issues, request logs let you deep dive into understanding which endpoints are causing problems, such as finding requests returning `403` status codes for missing permissions.
## Request Logs
Request logs help you see any API requests that Kombo is making to the integrated tool, and debug any issues. If an integration is having issues, request logs let you deep dive into understanding which endpoints are causing problems, such as finding requests returning `403` status codes for missing permissions.
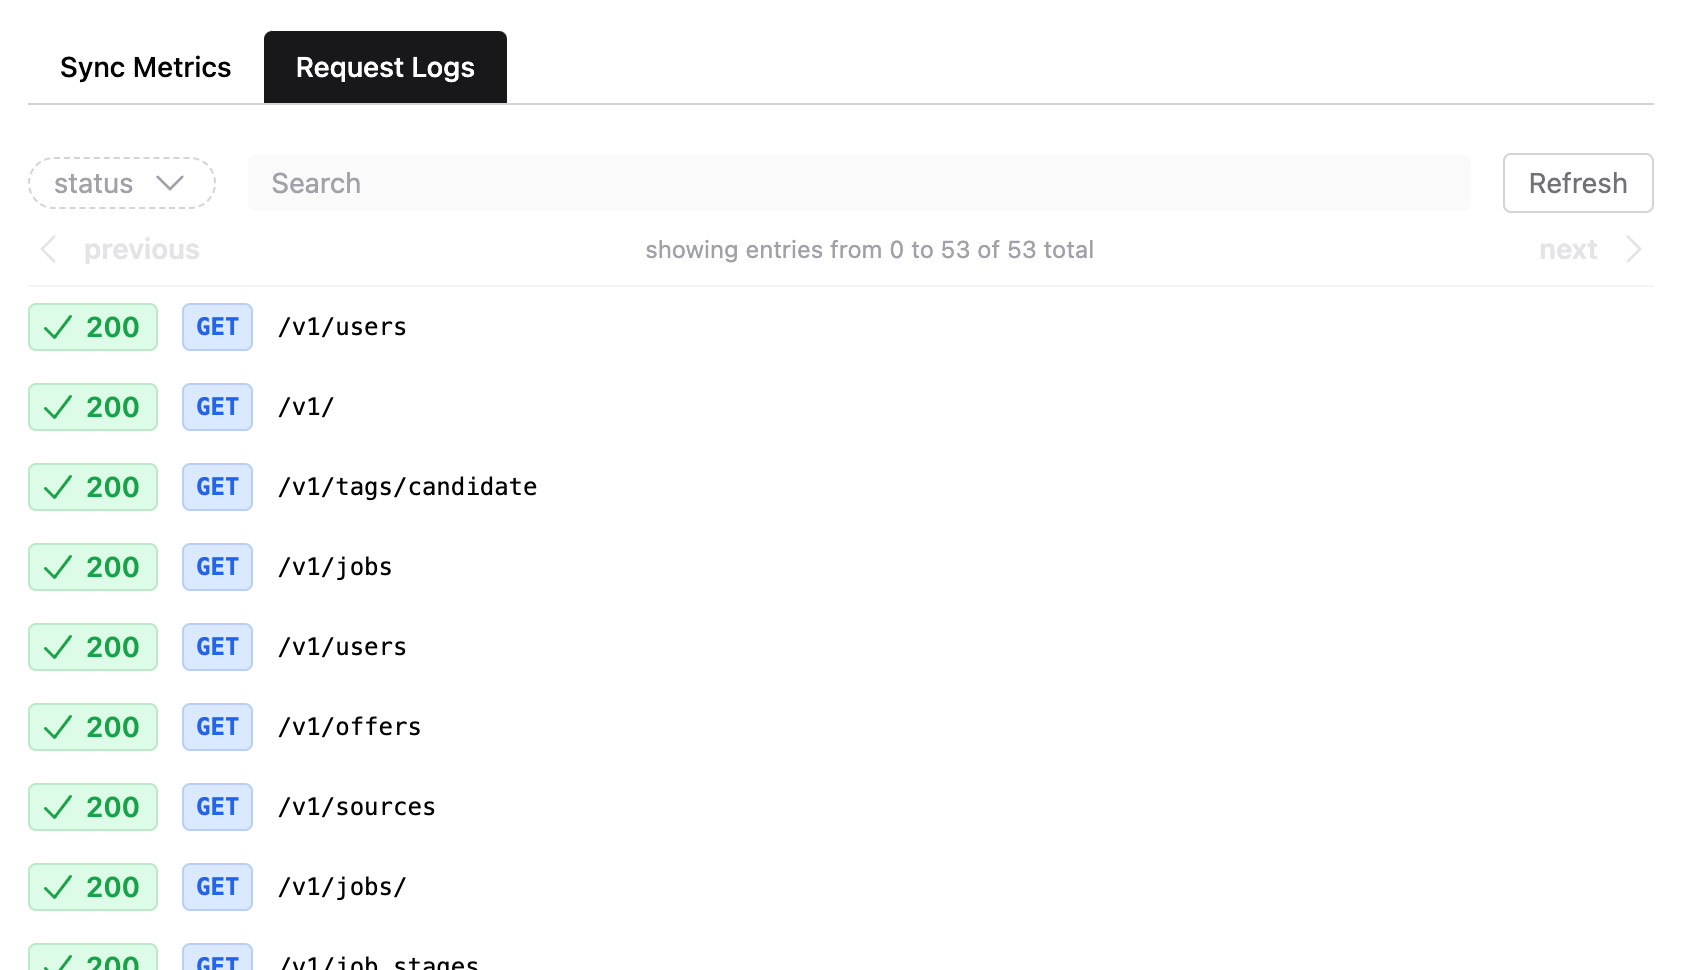 ### Viewing Details
Click on a row to view details of the API request. Kombo will redact any sensitive data.
You can view the response of the request by clicking on **Open response**.
### Viewing Details
Click on a row to view details of the API request. Kombo will redact any sensitive data.
You can view the response of the request by clicking on **Open response**.
 ### Retention
By default, Kombo stores logs for 30 days. Longer retentions are available upon request on the enterprise plan.
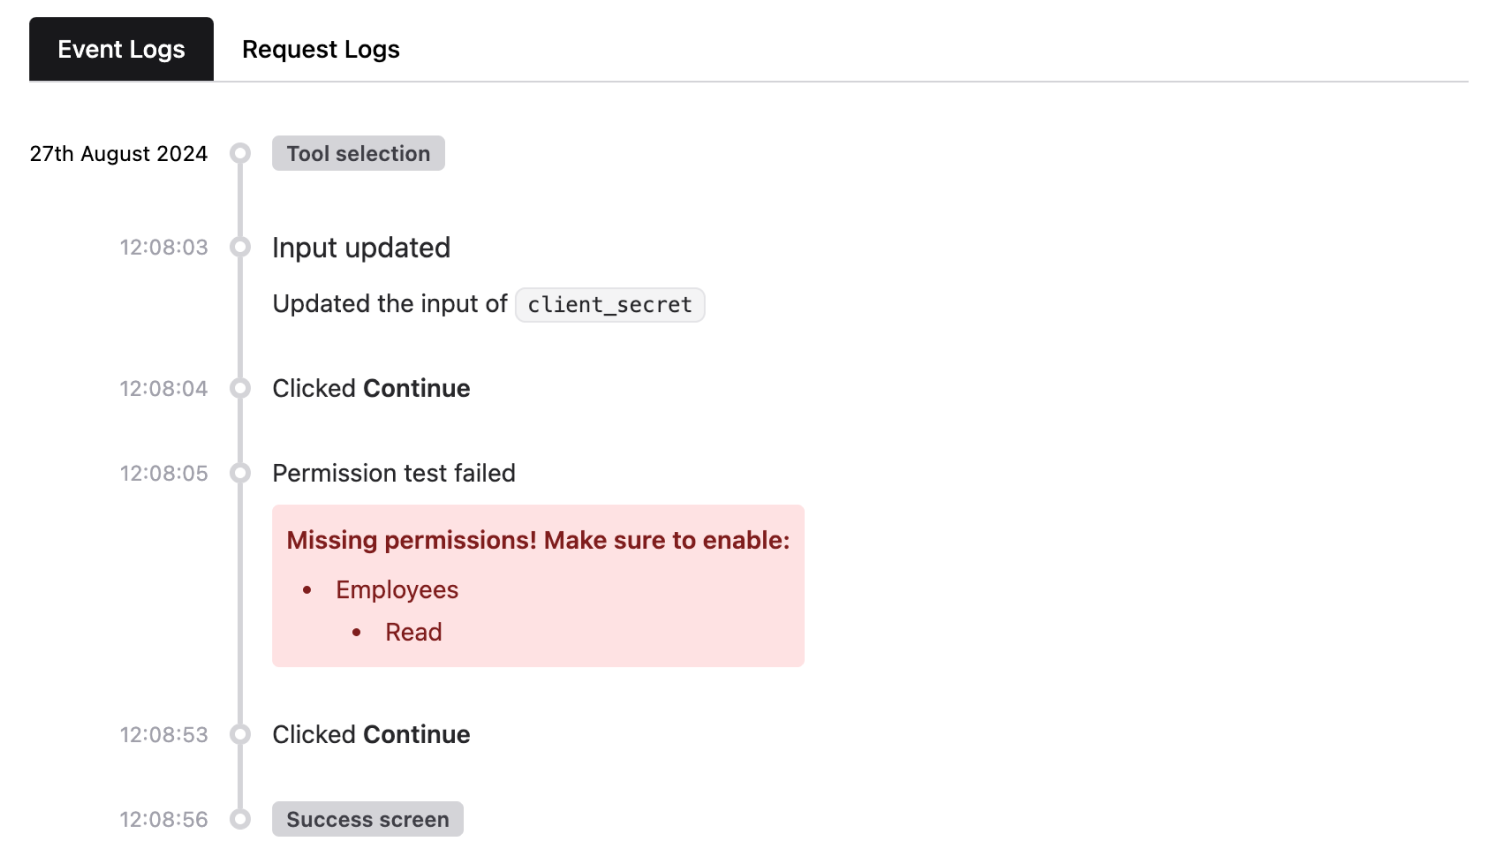
## Connection Flow Event Logs
We store any decisive events that happen throughout the connection flow to enable you to understand exactly what your customer is experiencing. This visibility lets you detect what is preventing your customers from connecting their tool, and ultimately reach out to them with the right help to complete the integration.
### Retention
By default, Kombo stores logs for 30 days. Longer retentions are available upon request on the enterprise plan.
## Connection Flow Event Logs
We store any decisive events that happen throughout the connection flow to enable you to understand exactly what your customer is experiencing. This visibility lets you detect what is preventing your customers from connecting their tool, and ultimately reach out to them with the right help to complete the integration.
 View your current connection flow logs in the [Kombo dashboard](https://app.kombo.dev/logs?kind=CONNECTION_FLOW).
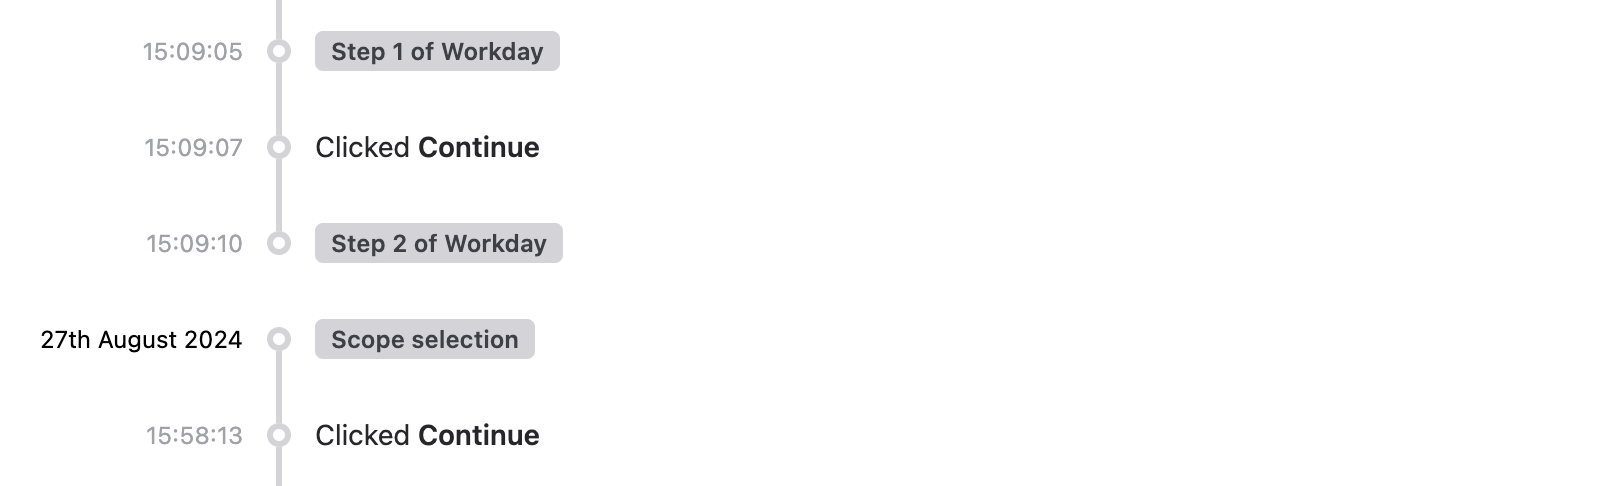
### Identifying User Sessions
The logs are grouped by user sessions, with a 'broken' line indicating a break between two sessions. Viewing sessions allows you to gain insights on when a user exited and/or re-entered the connection flow.
View your current connection flow logs in the [Kombo dashboard](https://app.kombo.dev/logs?kind=CONNECTION_FLOW).
### Identifying User Sessions
The logs are grouped by user sessions, with a 'broken' line indicating a break between two sessions. Viewing sessions allows you to gain insights on when a user exited and/or re-entered the connection flow.
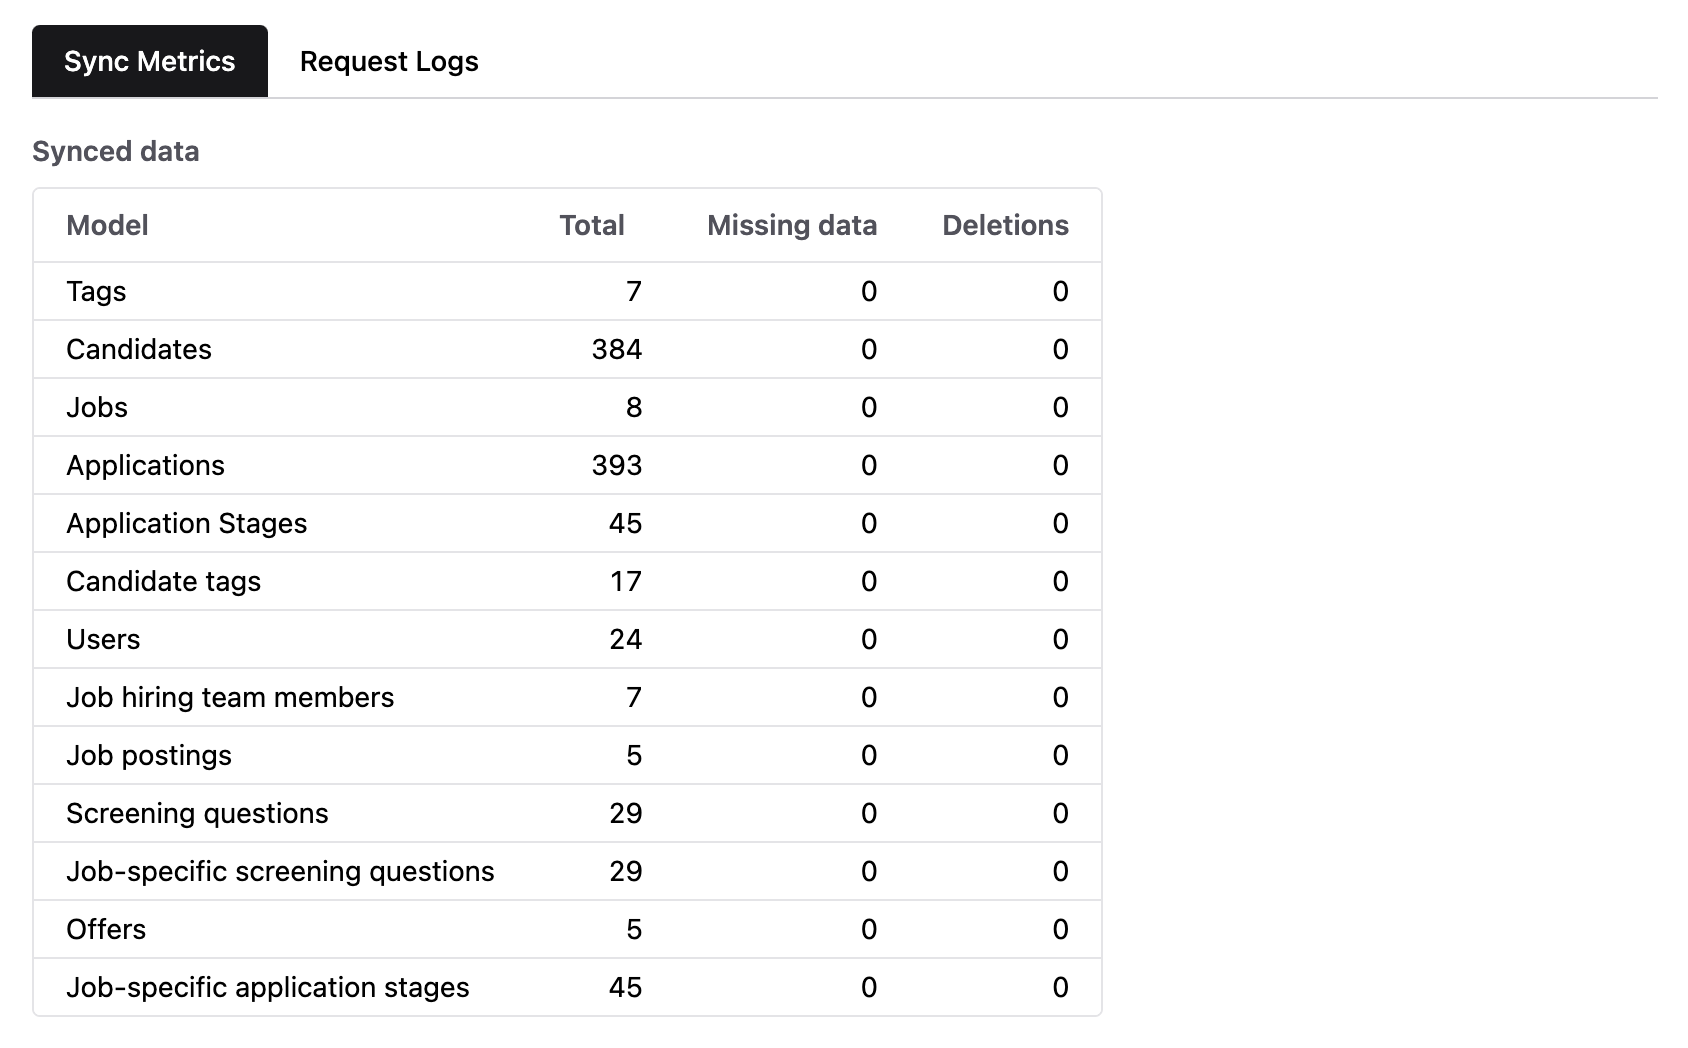
 ## Sync Metrics
The sync metrics tab allows you to gain insights into which data was read and whether any issues occurred. Use this to quickly verify that the expected data is being synced without having to make any API calls.
## Sync Metrics
The sync metrics tab allows you to gain insights into which data was read and whether any issues occurred. Use this to quickly verify that the expected data is being synced without having to make any API calls.